
Reporting
The numbers behind the pipeline.
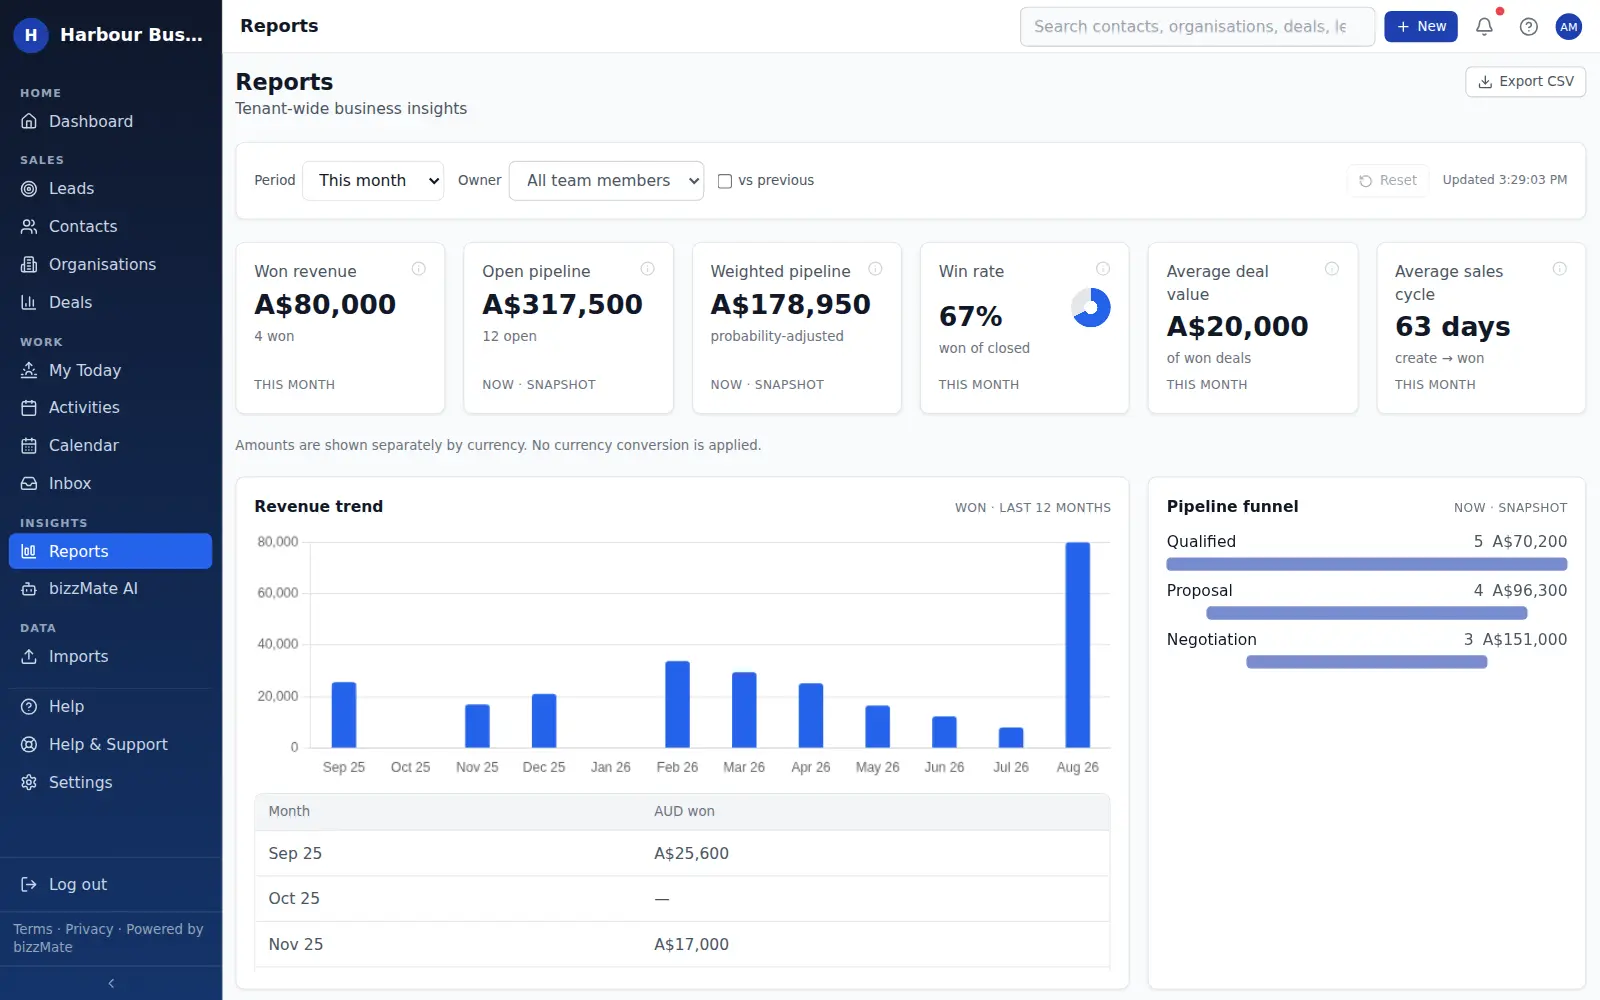
Won revenue, open and weighted pipeline, win rate, average deal value and average sales cycle — filterable by period and by owner, with the underlying records one click away.
No credit card required · Set up in minutes · AUD pricing
Why it matters
What reporting is for
Reporting in a small business fails for one of two reasons: there is none, or there is so much that nobody reads it.
bizzMate ships a small number of reports that answer the questions owners actually ask, built from the same records the pipeline uses, with CSV export when you need to go further.
At a glance
- Won revenue, open pipeline and weighted pipeline
- Win rate, average deal value and average sales cycle
- A twelve-month revenue trend
- Pipeline funnel by stage
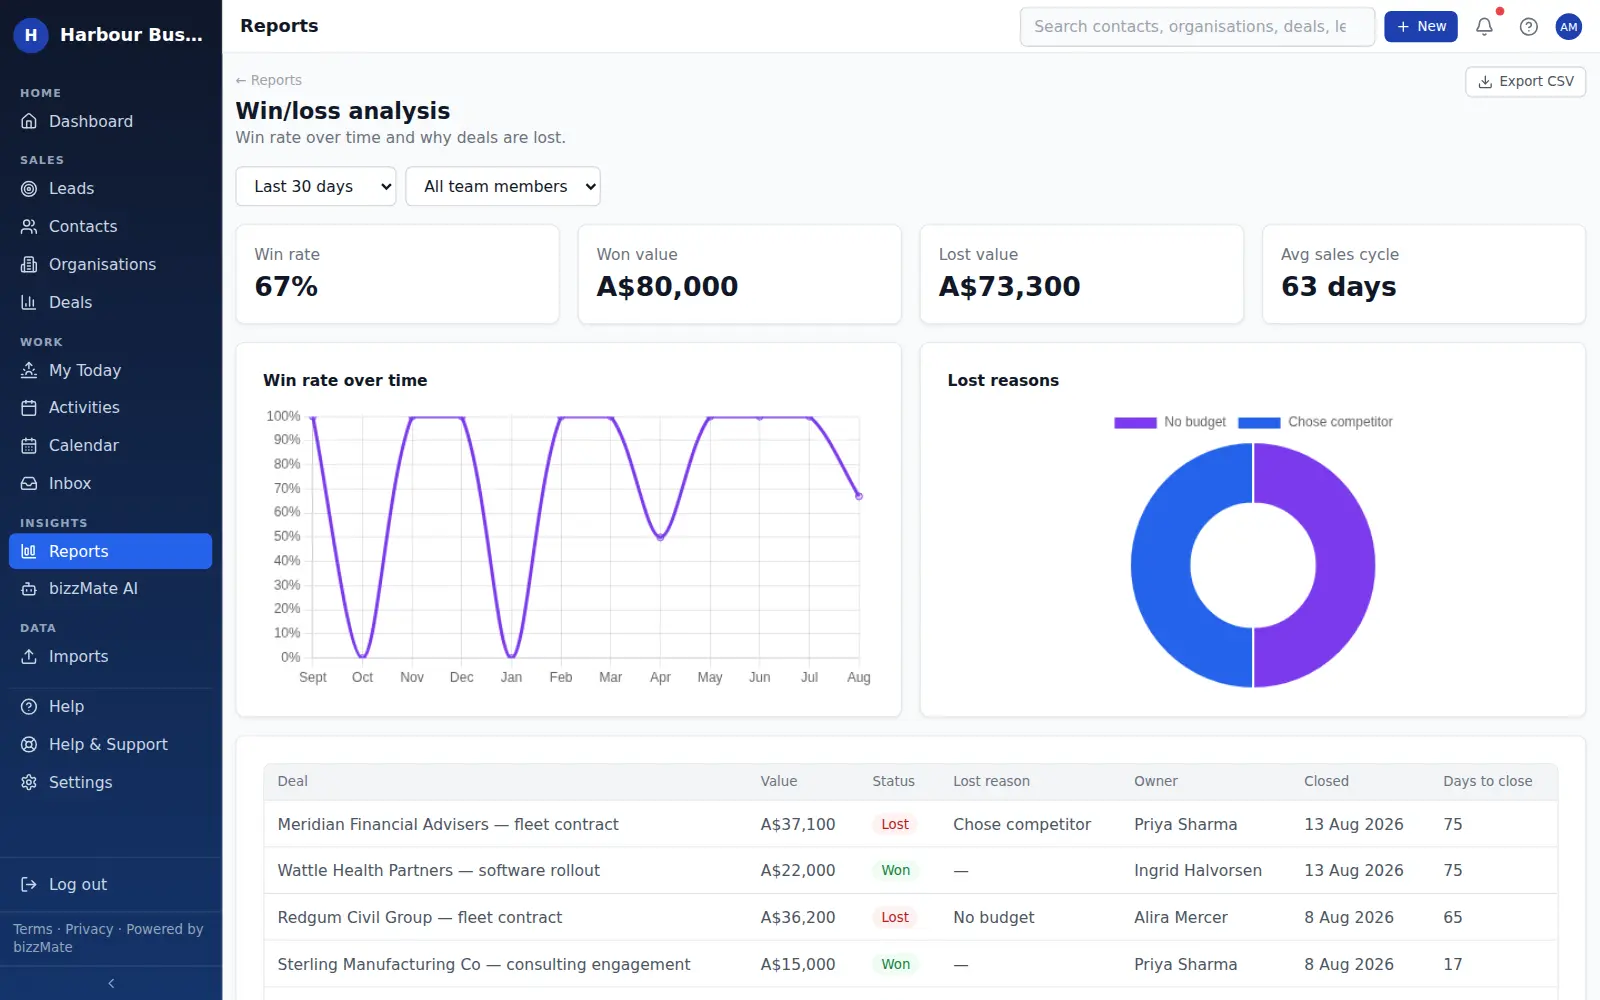
- Win/loss with the recorded loss reasons
- Activity and team performance by person
- Period and owner filters, with a compare-to-previous option
- CSV export
Capabilities
What it actually does
Every item below is a shipped part of bizzMate today — not a roadmap entry.
The overview, then the detail
The reports overview gives you the headline figures and the trend. Dedicated reports go deeper into pipeline, win/loss, activity, team performance and overall business pulse.
Periods that are labelled honestly
Every figure states the period it covers and whether it is a point-in-time snapshot or a range, so a pipeline number is never mistaken for revenue.
Why you lost, not just that you lost
Because closing a deal captures a loss reason, the win/loss report shows the pattern — price, timing, competitor — instead of a single number.
Per-person view without a surveillance culture
Owners and admins can filter by owner and see a team leaderboard of win rate and activity. Members see their own performance only, enforced by the server.
Take it with you
Export any report view to CSV when you need to build something specific or hand numbers to your accountant.
In the product
What this looks like day to day
How it works
How it fits a working day
Step 1: Check the overview weekly
Won revenue, pipeline and win rate for the month, compared with the previous period if you want the contrast.
Step 2: Go deeper when a number surprises you
The funnel shows where deals are piling up; win/loss shows why the ones that ended, ended.
Step 3: Filter by owner for a one-to-one
Pull one person's pipeline and activity before a catch-up so the conversation is about specifics.
Frequently asked questions
- Can I build my own custom report?
- Not inside bizzMate today. There is a fixed set of reports with period and owner filters, plus CSV export so you can take the underlying data into a spreadsheet or BI tool.
- Does reporting convert between currencies?
- No, and it says so on the page. Amounts are shown separately by currency rather than converted at a rate that would be out of date by the time you read it.
- Can a member see everyone's numbers?
- No. Members see their own performance. Workspace-wide reporting is limited to owners and admins, and that limit is enforced by the API rather than by hiding buttons.
Explore related capabilities
Try reporting on your own customers.
Start a free 15-day trial of bizzMate and set your workspace up in an afternoon. No credit card required.
No credit card required.